
A Monitoring Log Enablement Package is basically a Template file used to configure Windows Performance Monitor and contains Performance Counter, threshold values and other configuration settings. Windows Server 2003 uses a different Template file from that of Windows Server 2008 and Higher and the process to edit and import them are also different. Follow the detailed instructions below on how to edit Windows Server 2003 and Windows Server 2008 and Higher Log Enablement Package.
How to Edit Windows Server 2003 Monitoring Log Enablement Package
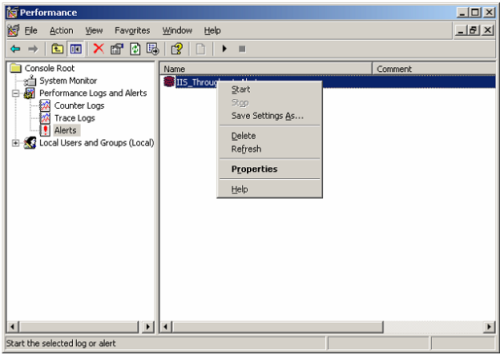
- Open Performance Monitor and expand the Performance Logs and Alerts
section.
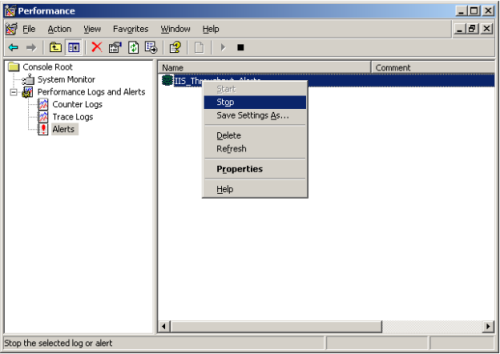
- Select Alerts and in the details pane right click the desired Log Enablement Package.
- If the Log Enablement Package is started select Stop.
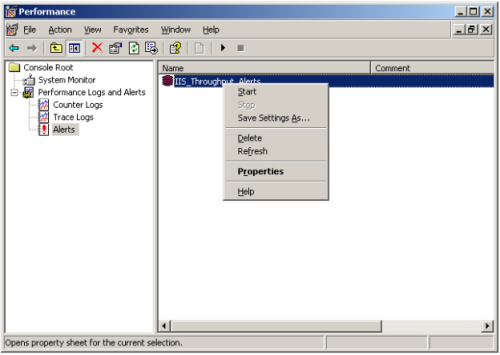
4. Then right click the Log Enablement Package again and select Properties.
5. The General tab allows you to Add, Remove and configure counters.
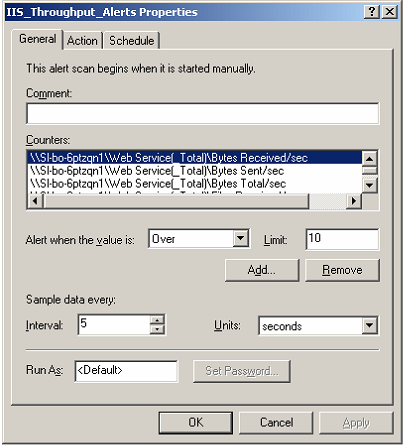
6. Highlighting the counter displays the performance configuration. An alert can be set to trigger if the
counter value is over or under a set limit. This data can be obtained over a customizable interval in
seconds, minutes, hours, or days. You can change what user the Alerts Settings will Run As, just enter
a user name and Set Password. Built-in groups have access to the following Performance Monitor features:
- Members of the local Administrators group
- All performance monitor features are available to this group.
- Members of the Users group
- Members of the Users group can change the Performance Monitor display properties while viewing historic data.
- They can view log files in Performance Monitor.
- They cannot create an Alert Setting as a member of this group.
- Members of the Performance Monitor Users group
- Can use all features available to the Users group
- Can view real time logs in Performance Monitor and alter Performance Monitor display properties in real time.
- Cannot create or modify Alert Settings.
- Members of the Performance Log user group
- Members of this group can use all the features that are available to the Performance Monitor Users group.
- Members of this group can create and modify Data Collector Sets after the group is assigned the Log on as a batch user.
6. Clicking the Remove
button removes the selected counter and clicking the Add button displays the Add
counters dialog.
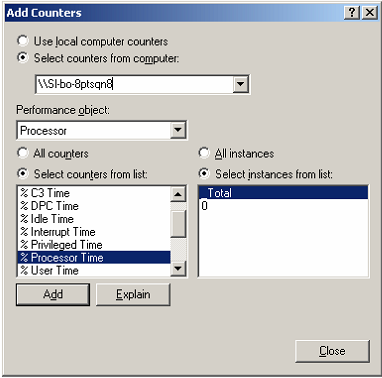
This dialog is used to select Performance counters based on Performance Objects.
Note. The list of Performance Objects depends on the
system resources or applications installed on
the system for example if SQL Server is not installed there will be no SQL Server Performance Objects
and no SQL Server performance counters locally on the system. However counters can be obtained from
a remote computer by Selecting counters from computer and enter the computer name in the text box.
When done Close dialog. All selected counters will be listed under Counters.
Click Ok to close the dialog.
7. Right click the Log Enablement Package and select Start.
How to Edit Windows Server 2008 and Higher Monitoring Log Enablement Package.
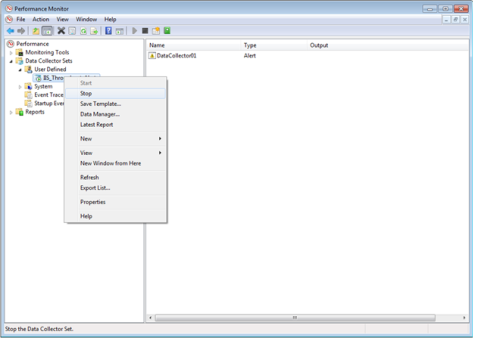
1. Open Performance Monitor and expand Data Collector Set then expand User Defined.
2. Select the Data Collector Set you would like to edit and if it is running click Stop.
3. Right click the DataCollector in the right pane and select properties.
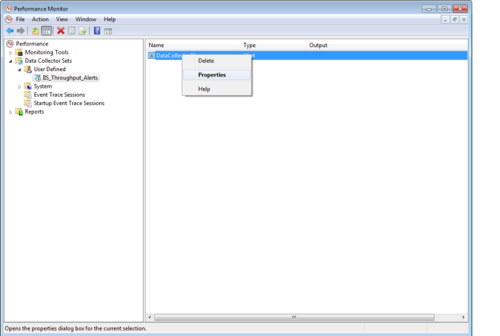
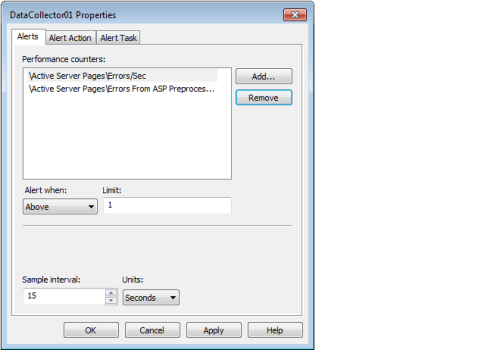
4. The DataCollector properties dialog box displays the Alert tab.
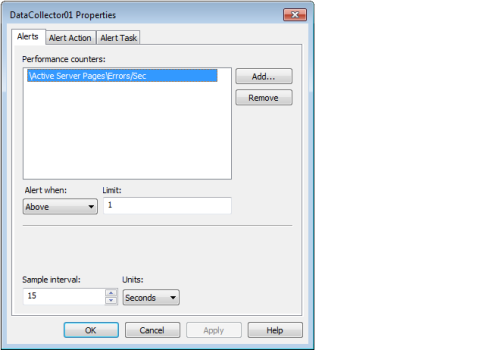
The Alerts tab allows you to Add, Remove and configure counters.
Selecting the Performance counter allows you to configure its threshold and interval attributes.
An alert can be configured to trigger if the counter value is over or under the limit set.
This data can be collected over a customizable interval seconds, minutes, hours, or days.
Click the Remove button to remove selected counter from the Performance counters list,
and click the Add button to displays the Add counters dialog.
5. The Add Counter dialog is used to select performance counters based on performance objects.
Performance counters are grouped based on a particular performance objects. For example all counters for Active Server Pages are grouped together.
Only applications installed locally will have performance objects and counters displayed from the local computer.
Objects and counters from a remote system can be selected here by entering the computer name or Browsing to that computer.
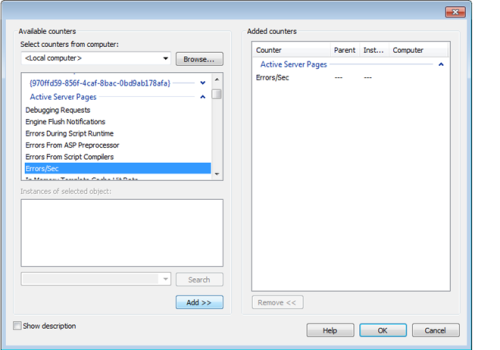
Once the counters are selected they can be added by clicking the Add>> button and removed by clicking the Remove<< button.
6. Click Ok once all counters have been added, they will be displayed in the performance counters list on the DataCollector Properties dialog.
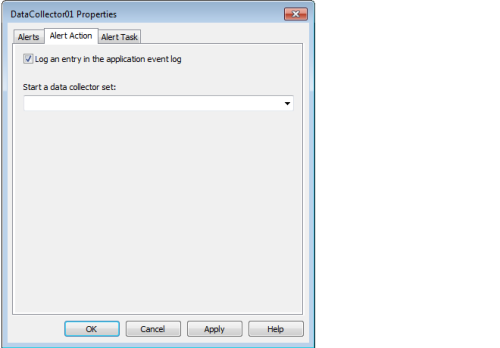
7. The Alert Action tab gives the option of sending alerts to the event log and starting a Data Collector Set once an alert is triggered.
8. The Alerts Task allows you to run a task when the alert is triggered.
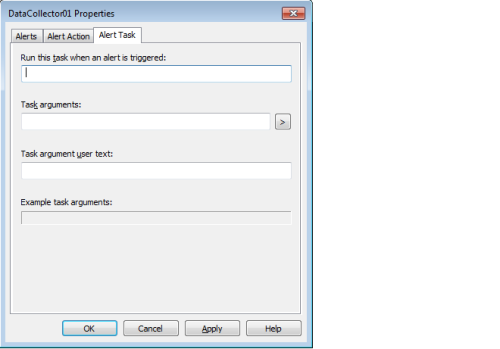
Click Ok to complete DataCollector Property changes. If you are satisfied with changes made to the Performance alerts you may start the Data Collector Set by right clicking the Data Collector Set and selecting Start.

Comments